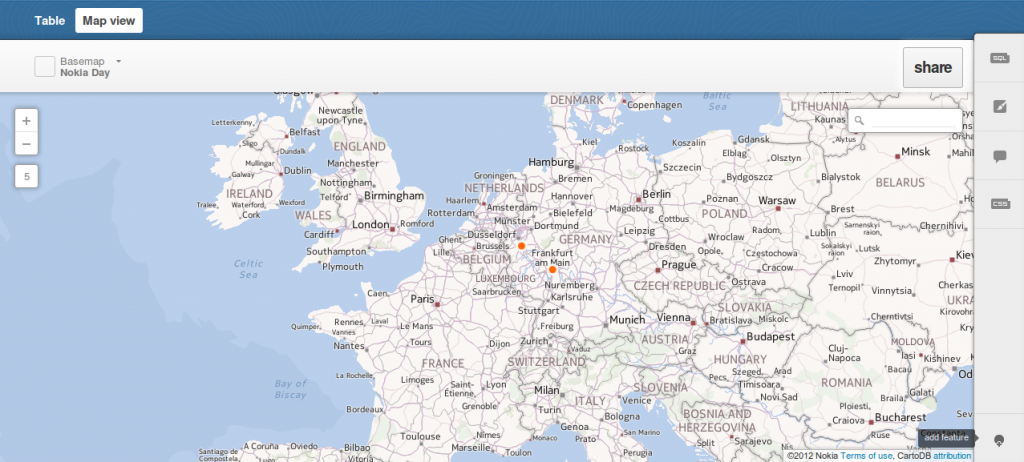
We have already introduced cartoDB which is a platform for storing, administering and visualizing spatial data. One straight feature of cartoDB is the usage of GeoJSON for exporting their tables. In this tutorial I’ll document a working example on consuming this layer with leaflet. But first we will start with the easy part of creating the table in cartoDB.
In this tutorial I’ll show you, how to combine text information with spatial information using the open source software QGis. You can easily download and install QGis from the following Source: QGIS DOWNLOAD PAGE.
David vs. Goliath? Since years I work with QGis, now I will test the OpenSource ERDAS pendant Opticks for remote sensing issues with raster data. It would be very nice, if I could ban all evil proprietary GIS-software from my dektop for ever. The specs of Opticks sounds very good – lot of data types are supported, Opticks can handle big data load (>16 GB per image) etc. After that I had to install the glorious piece of software to my Linux-OS (it’s also available for Windows and Solaris as well). Let’s get a first impression of Opticks You can…
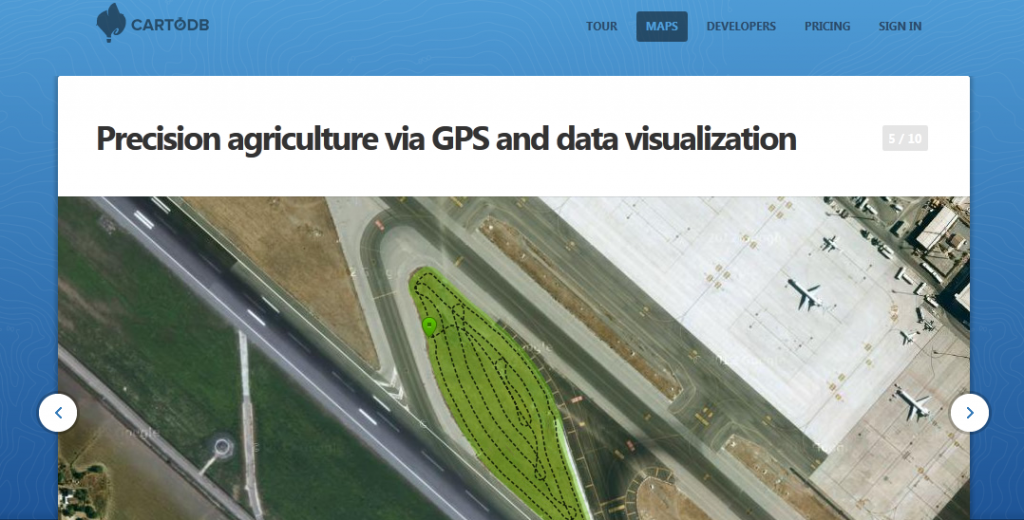
As we are running several projects besides this blog we ran across CartoDB. CartoDB is more or less a nice GUI that serves you either a table of your data or a map that refers to this data. As a user you register yourself and you are able to use the service for free if one can waive the feeling of privacy.
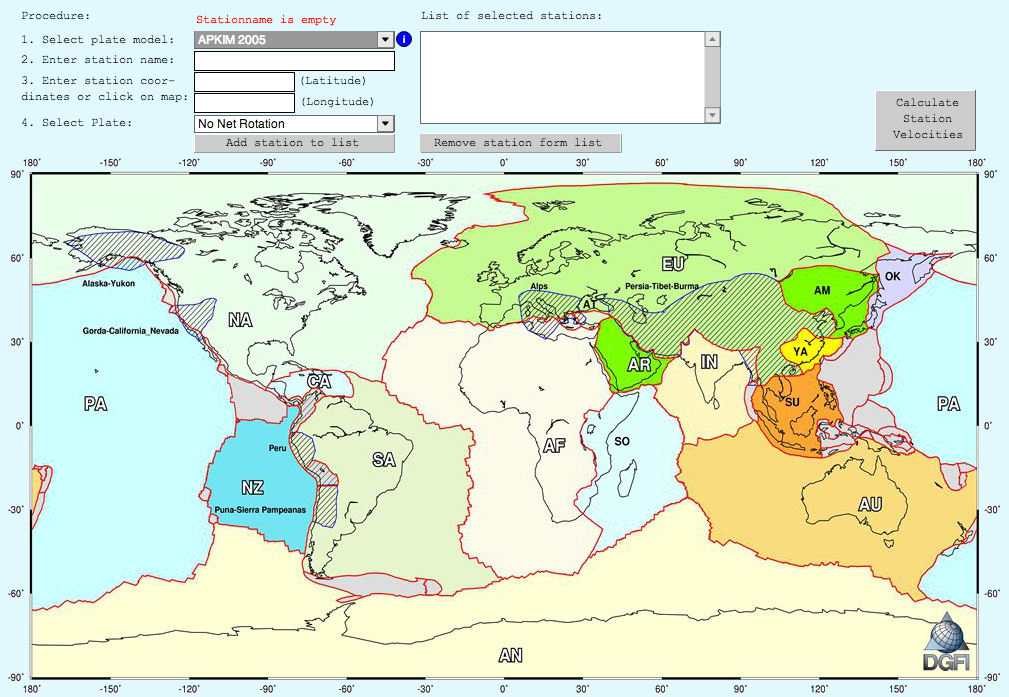
The german geodetic research institute provides a visualizer to retrace the distribution and movement of our continental and oceanic plates. The tool represents the plates models: NUVEL-1, NNR-NUVEL-1, NUVEL-1A, NNR-NUVEL-1A, PB2002 and APKIM 2005.
When I was starting with Ubuntu I was struggling with getting QGIS to run on Ubuntu. Actually it is not a big deal despite of adding a repository to your system. So in this video I am starting with a clean install of Ubuntu 12.04 Precise Pangolin so everyone can follow me: the lines to edit in your sources.list file are:
The digital map collection of the Perry-Castañeda library (University Texas) is a free map download source. For many countries you can get map data right online. Besides current topographic maps, the virtual library provides historical and thematic maps as well.
Previous Posts in this series QGIS Plugin – RasterCalc QGIS Plugin – OpenLayers So, this will be a pretty quick post on one of my most used QGIS plugins, the Profile tool. The Profile tool can be downloaded from the central QGIS plugin repository HERE. In a nutshell, the Profile tool allows you to draw a line in your QGIS project area and get the profiles of various layers in your project, as seen here: The most obvious use of this tool is looking at terrain profiles, and it certainly is very useful for this. However, in the example…
[jetpack_subscription_form show_subscribers_total=0 title="Newsletter" subscribe_text="Subscribe to our Newsletter and don't miss a post! Tragen Sie sich in unserem Newsletter ein und verpassen Sie keinen Artikel" subscribe_button="OK" ]